Carbon · Water · Waste · United States
Every figure traces back to the page it came from.
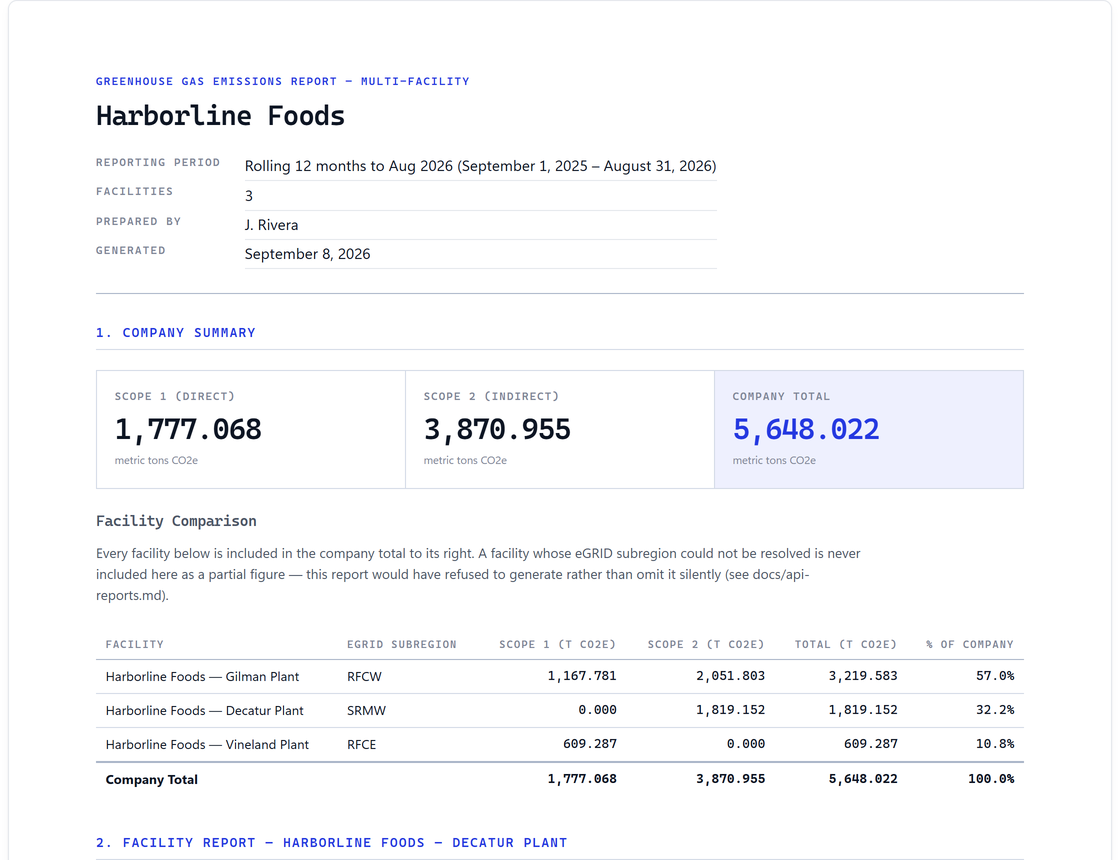
Metrifer reads your utility invoices, calculates greenhouse-gas emissions, and shows the exact region of the exact document behind every number in the report. The arithmetic is the easy part. The evidence is the product.
A sample manufacturer’s year of bills, in your own private copy.
Would rather use one of your own invoices? Run it in your browser — that tool reads the file on your machine and uploads nothing at all.
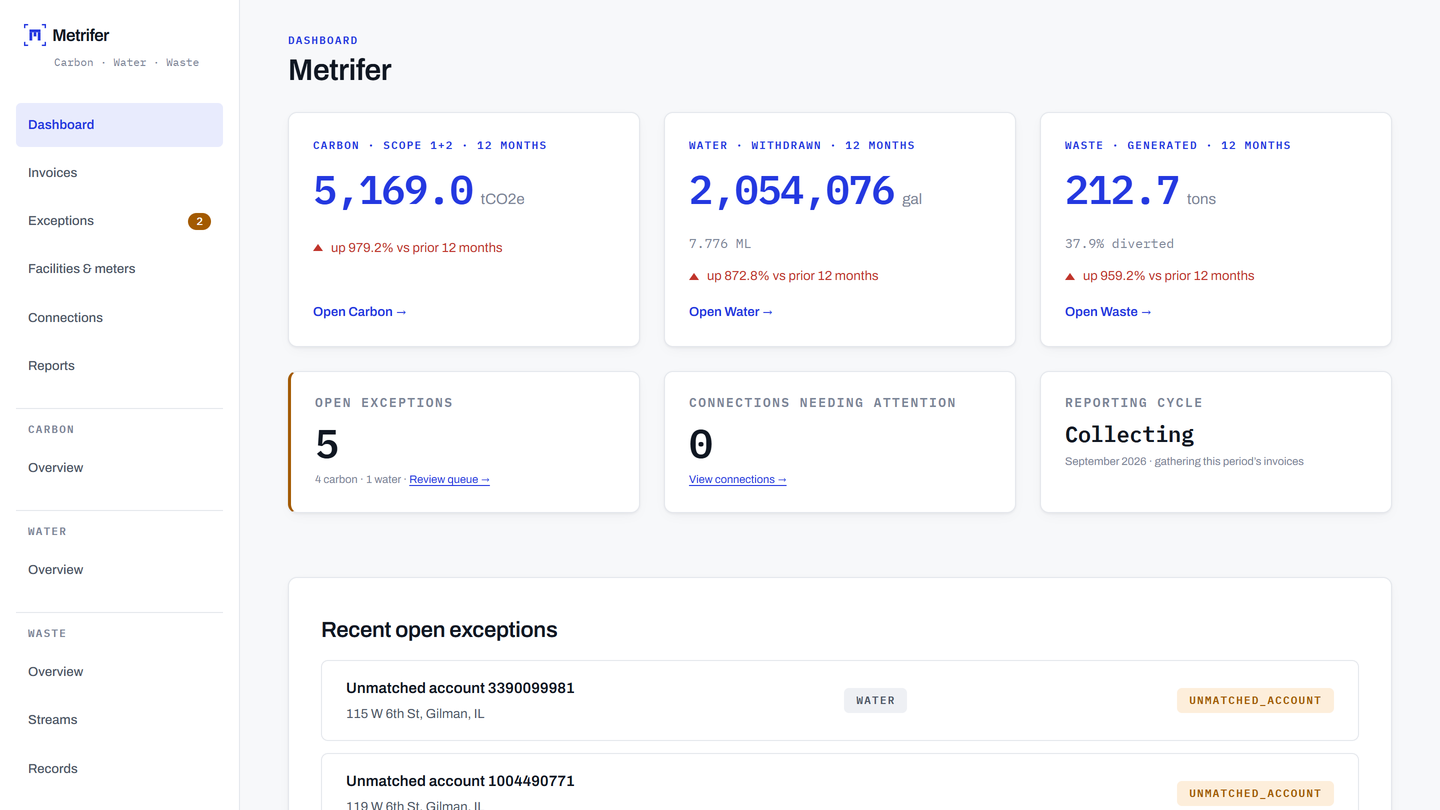
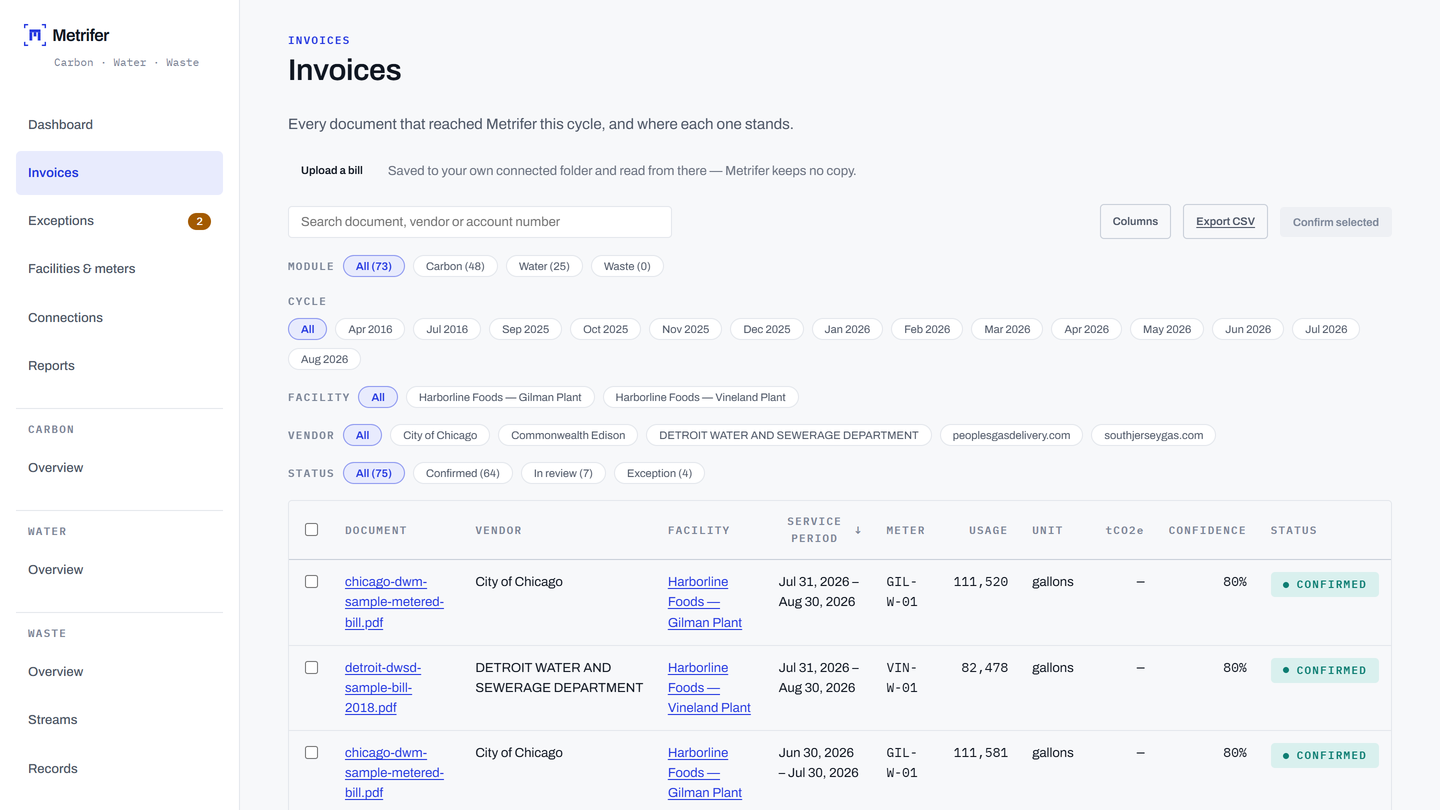
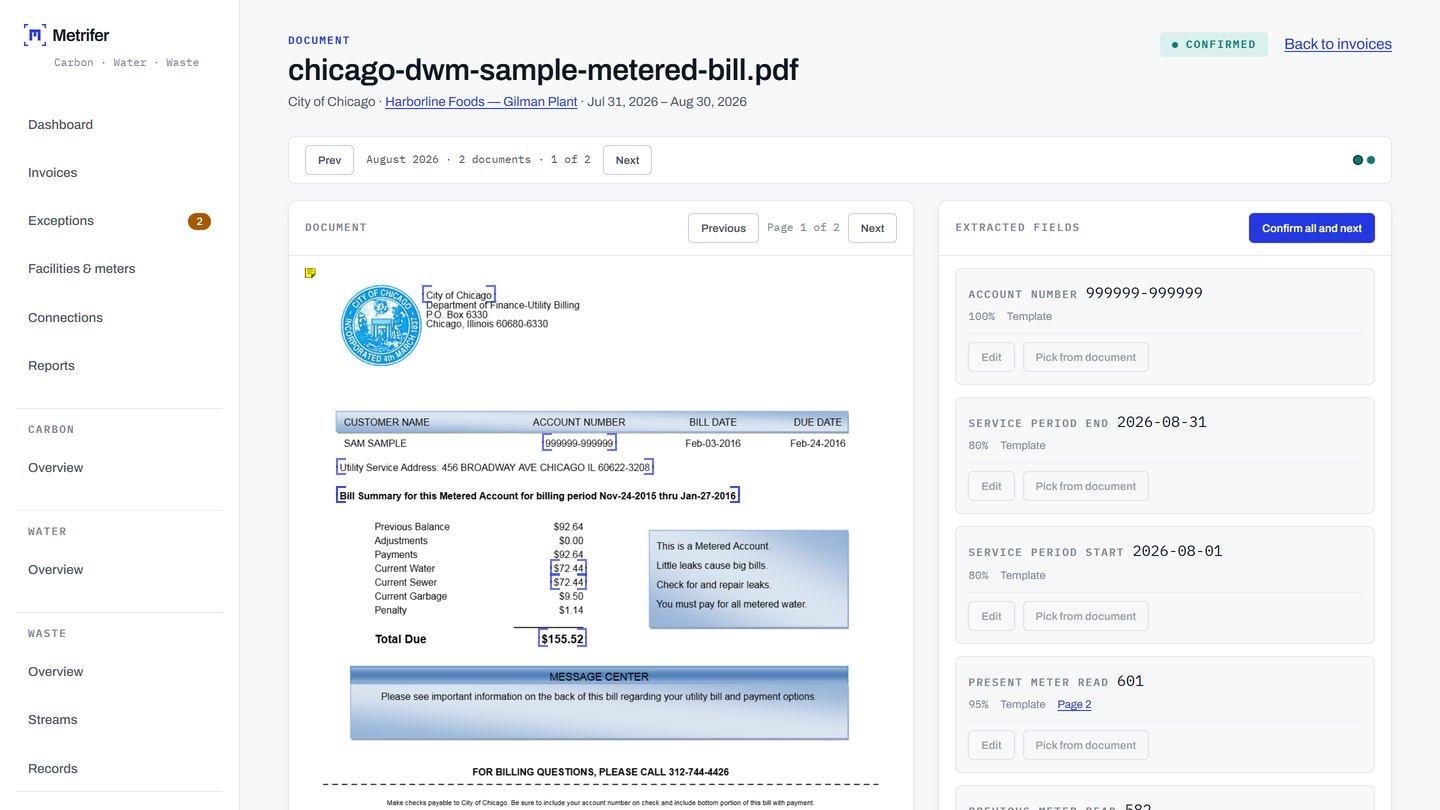
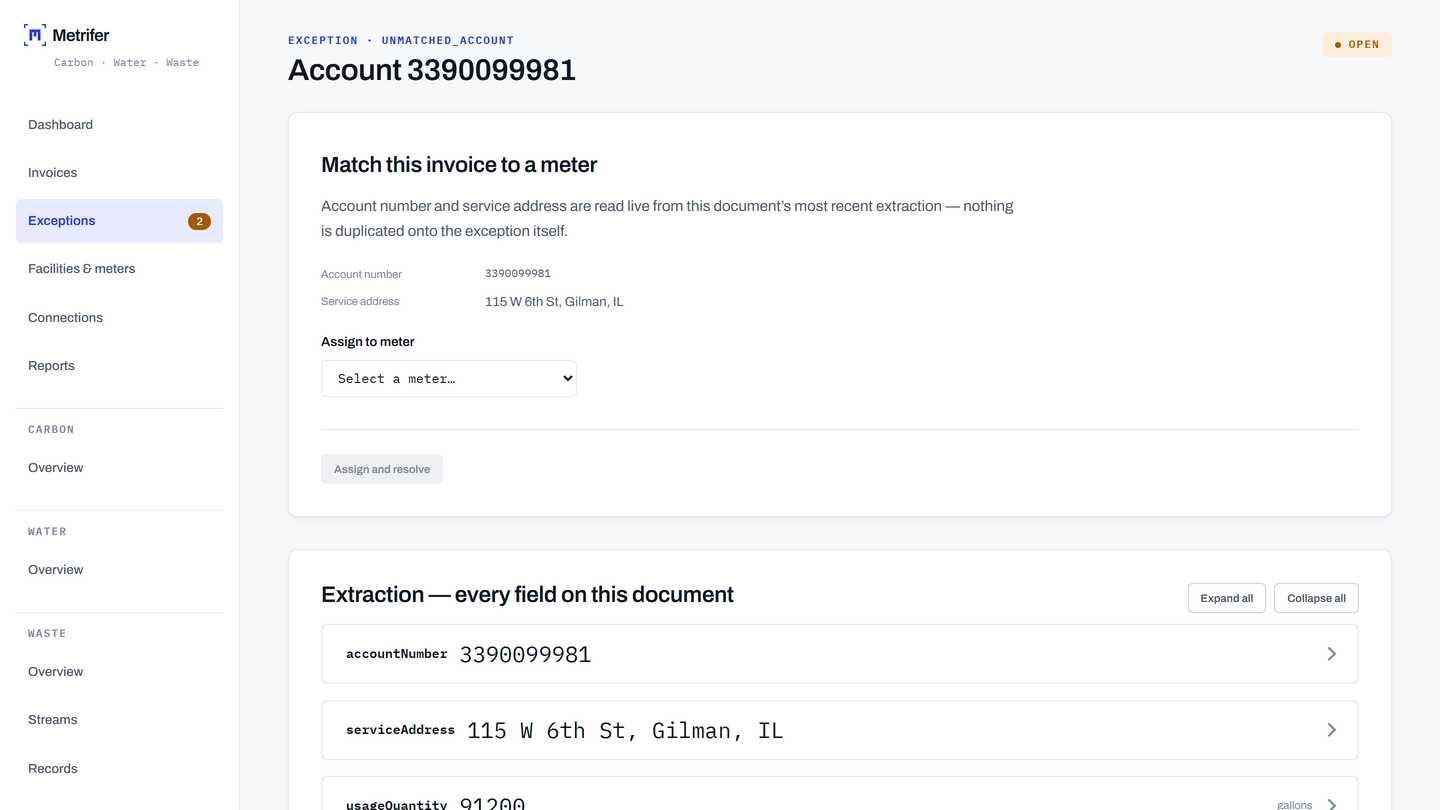
The product
From the bill to the report, every step is on screen.
The problem
The typing was never the hard part. The finding was.
The bills arrive as PDFs
Often from small regional utilities with no customer portal and no data feed, so there is nothing to integrate with.
Someone hunts them down
The real cost. Across dozens of meters, several plants and utilities whose billing calendars don’t line up, finding the right invoice and matching it to the right meter eats the overwhelming majority of the cycle.
Then types them into a spreadsheet
Usage, cost, dates, by hand, into a template that rejects the whole file if a column is out of place.
And the trail stops there
When an auditor asks where a number came from, the answer is a folder of PDFs and someone’s memory.
What Metrifer does
Reads the bill. Keeps the evidence. Emails the report.
Provenance, not just a number
Every value carries the document, the page and the rectangle it was read from, who confirmed it, and which emission factor and vintage produced the result.
Corrections never overwrite. A changed value is recorded as superseding the old one, and both remain — so a report from three years ago still reproduces exactly as it was reported.
The invoices come to you
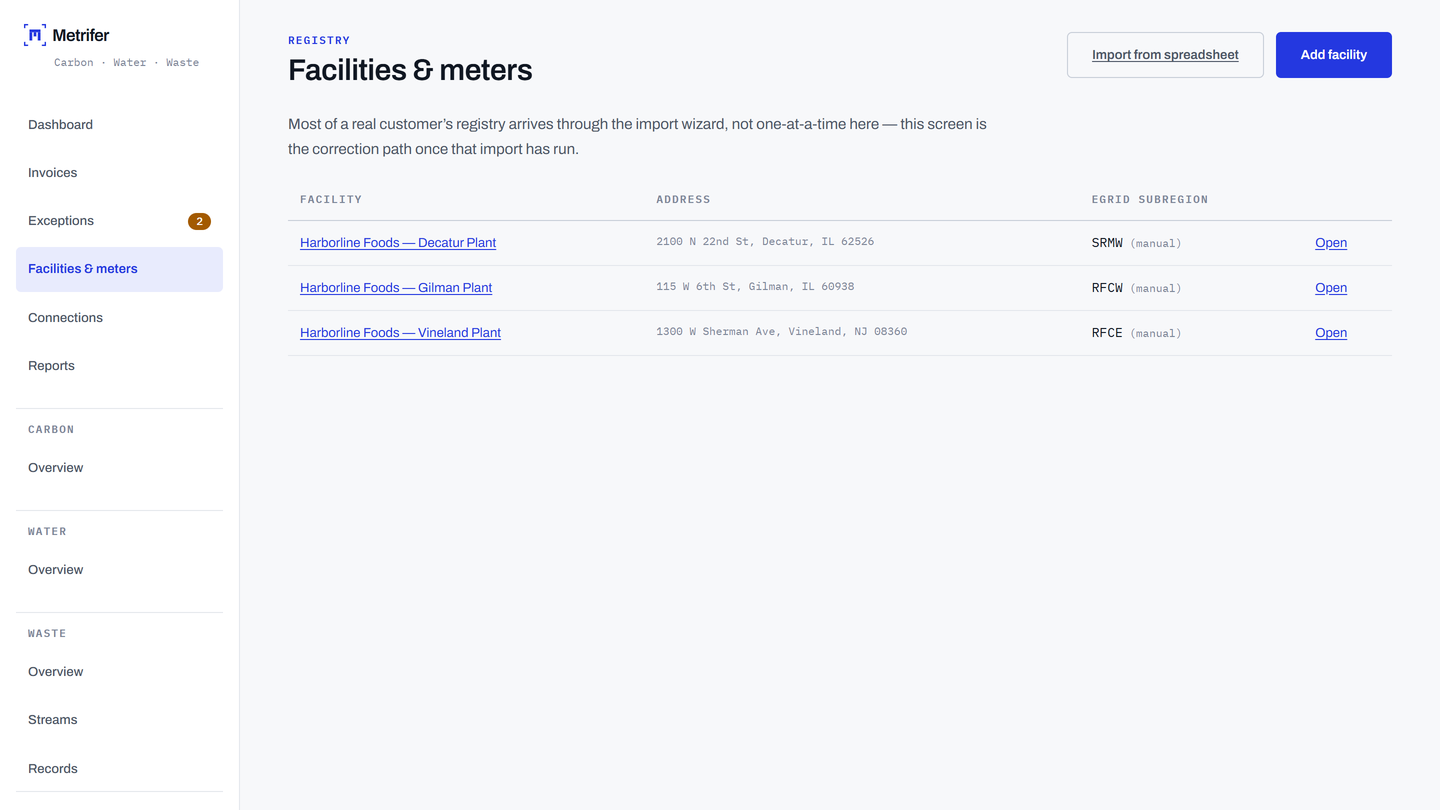
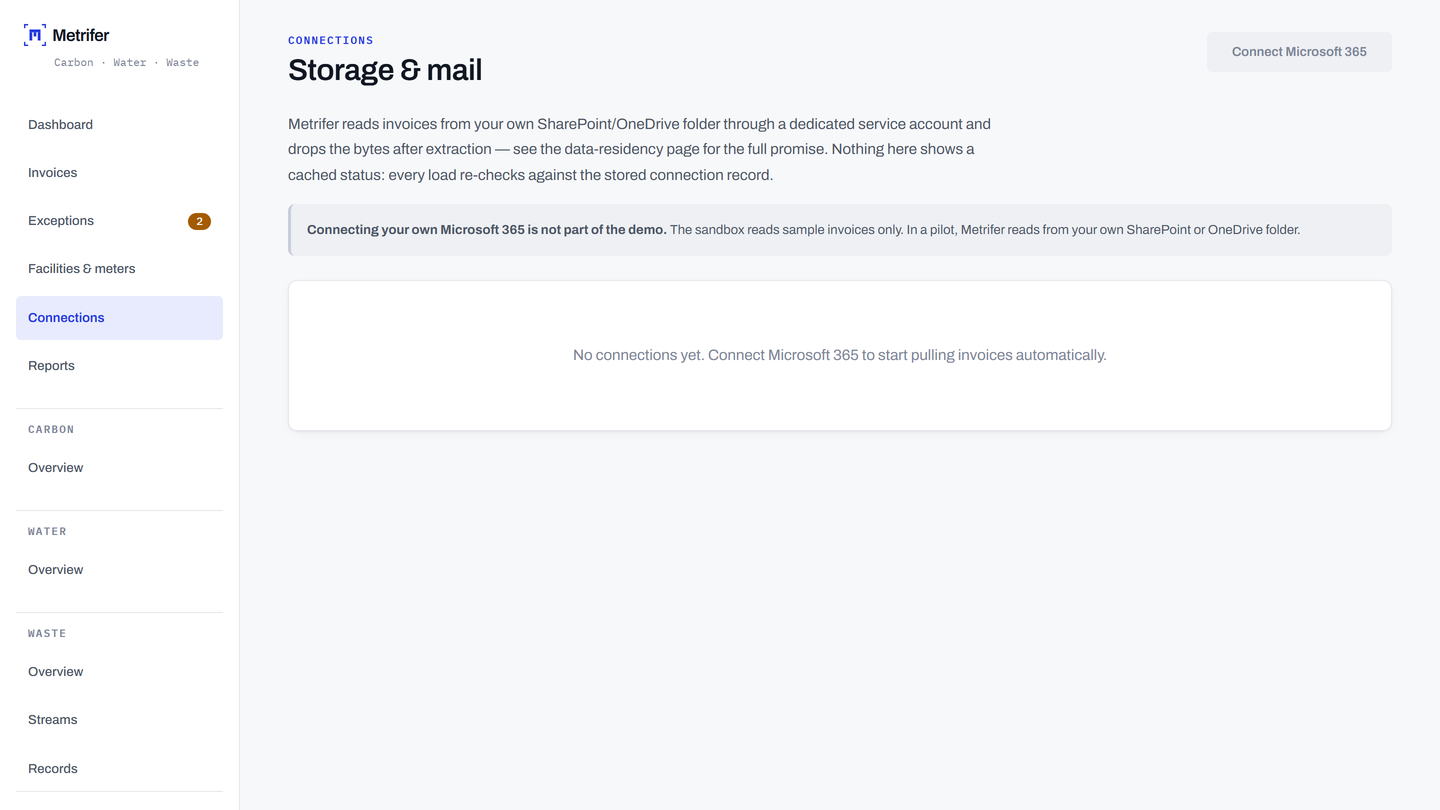
Bills land in a folder in your own SharePoint, OneDrive or Google Drive — forwarded by accounts payable, or dropped in as a batch from the utility portal. Getting them into the folder is one bulk step, once a month.
Metrifer reads that folder through a dedicated account in your own tenant, and matches every bill to the right meter by its utility account number. It does not copy your documents onto our servers.
Reports arrive by email from your own domain, and the audit trail records that the application read a document — not that one of your staff did.
Confidence you can check
Nothing is trusted because a model sounded sure. Every read is scored against the bill’s own arithmetic — usage times rate reproducing the charge, line items summing to the total, the period spanning the printed number of days.
Anything that fails goes to a person for review rather than quietly into a total.
It runs on a clock, not on your attention
Invoices accumulate for three weeks. Exceptions get a week. The report lands at month end, with a nudge if anything is still outstanding.
Most people never open the app. It shows up in their inbox, which is where they already work.
Scope
What it covers, and what it does not.
| Covers | Today |
|---|---|
| Scope 1 | On-site combustion — natural gas, diesel, propane. EPA GHG Emission Factors Hub. |
| Scope 2 | Purchased electricity, location-based, by eGRID subregion. |
| Region | United States. |
| Not yet | Market-based Scope 2, Scope 3, and non-US grids. Water and waste are next on the roadmap. |
Modules
Three modules. One mailbox. One report.
Metrifer reads whatever your facilities are billed for. Each module is licensed on its own, per facility, and every module’s figures land in the same month-end report from the same metrifer@ address.
Metrifer Carbon
Scope 1 and 2 from the utility bill.
Gas, electricity, diesel and propane invoices, read to the field, with EPA and eGRID factors cited on every line.
- Reads PDF invoices from your own drive
- Lineage to the page and rectangle
- GHG Protocol-shaped report
Per facility, per year · available now
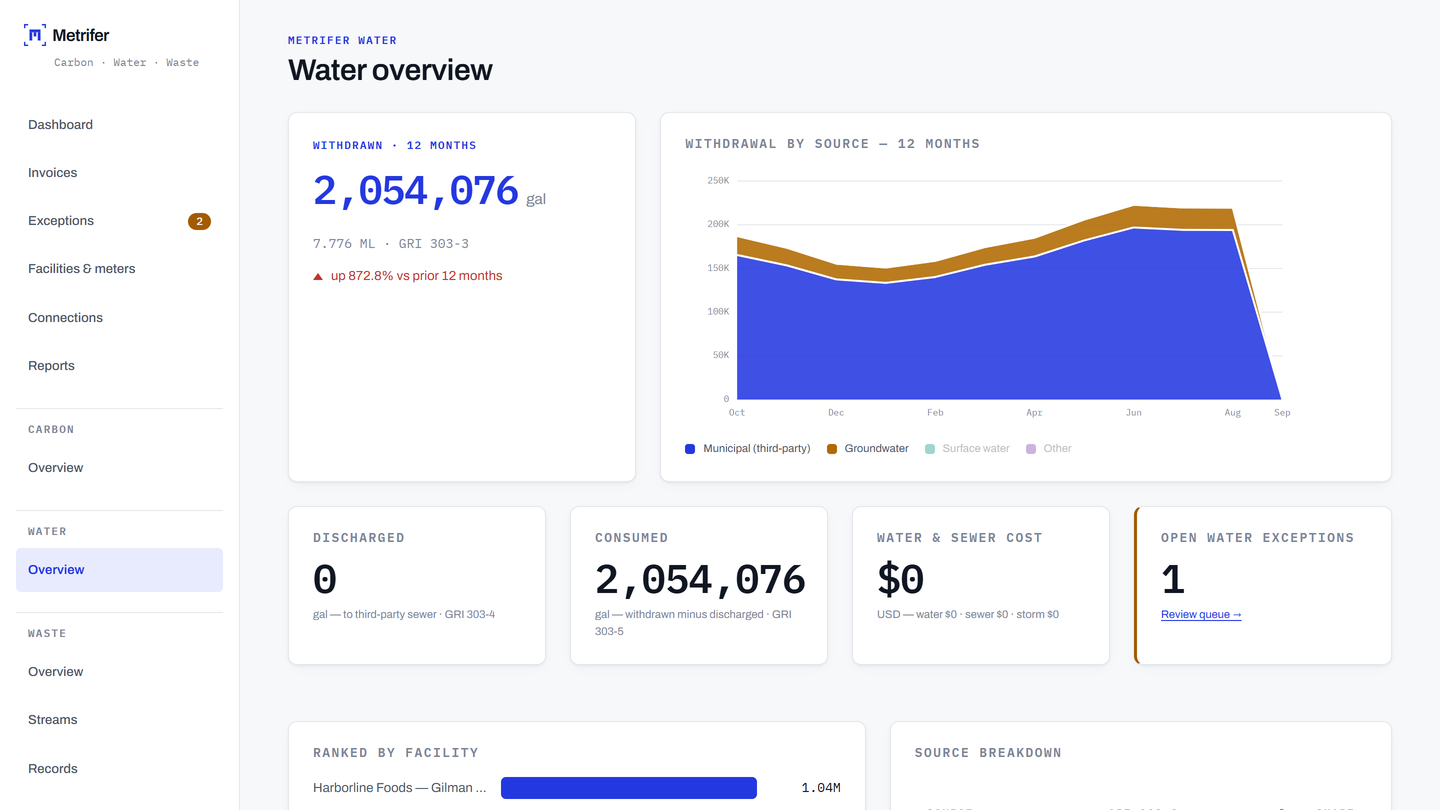
Metrifer Water
Withdrawal, discharge and consumption.
Municipal water and sewer bills, well meters entered by hand, and the conversions from CCF to gallons and megalitres shown on the line.
- Same drive, same mailbox, no new accounts
- GRI 303 and CDP Water line items
- Sewer on metered intake or winter average
Per facility, per year · pilot
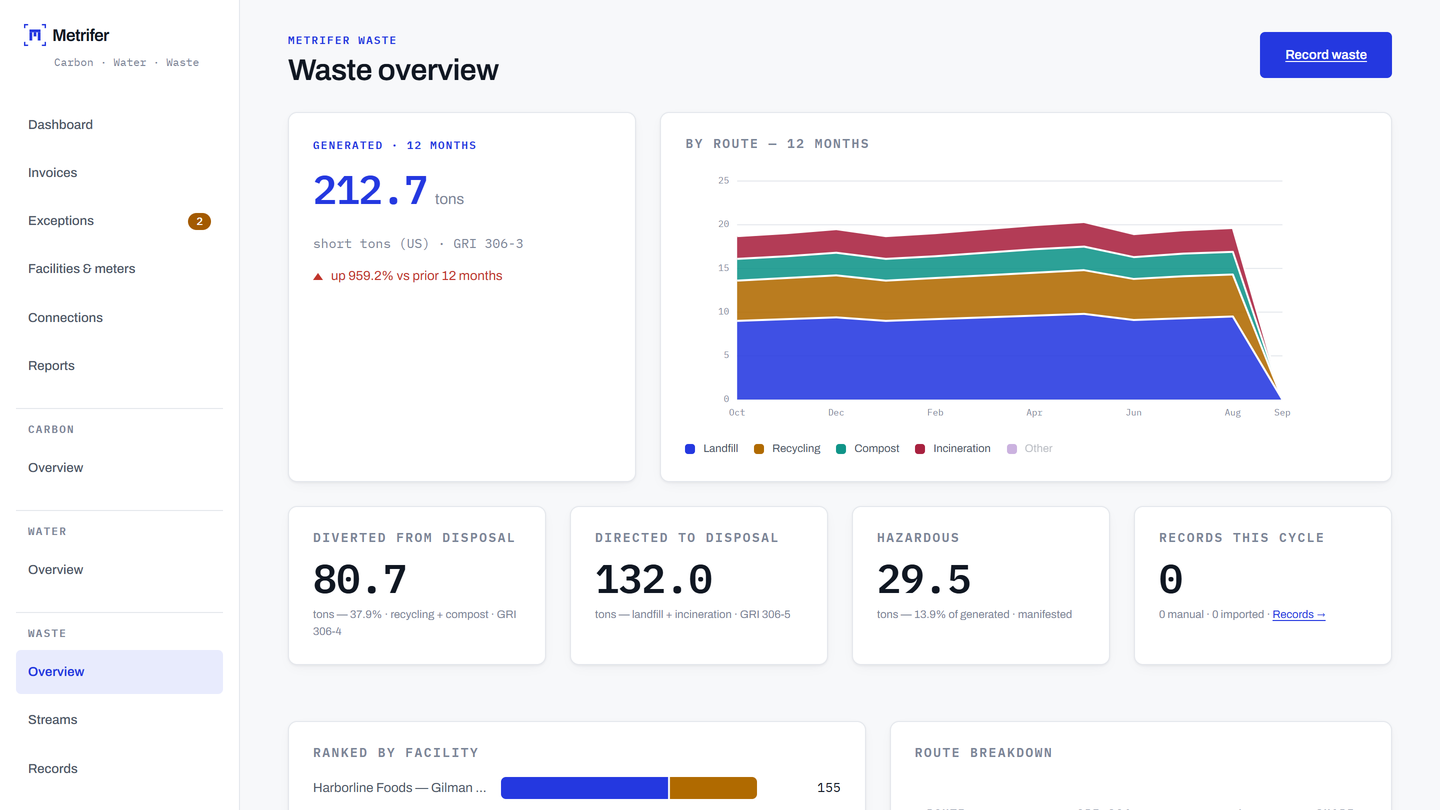
Metrifer Waste
Every pickup, in tons, by route.
Hauler invoices, spreadsheet imports and hand entry for what has no paperwork. Hazardous manifests keyed by tracking number.
- Diversion rate and GRI 306
- Declared density per stream
- Manifests deduplicated on the tracking number
Per facility, per year · next
Add a module later without a second sign-in, a second mailbox or a second IT ticket.
Where things stand
Early, and honest about it.
The extraction and reporting engine is real and you can use it right now. The demo reads genuine utility bills, scores every value against the bill’s own arithmetic, and produces a full report with lineage — in your browser, with nothing uploaded anywhere.
The hosted platform is in development. Connectors, scheduled runs, accounts and stored history are being built now. We are taking a small number of pilot conversations with multi-site companies who do this by hand today and would rather shape the product than inherit it.
If that is you, the useful first step is fifteen minutes and one of your actual invoices.